Metrics
Choosing AI Evaluation Metrics Before Shipping: A PM's Guide
Listen — audio summary in Nehal Vyas's voice
Transcript
Hey everyone, Nehal here. Today I want to talk about one of the most pivotal decisions for any AI Product Manager: choosing the right evaluation metrics before you even ship an AI feature. This isn't just a technical exercise; it's a strategic imperative that directly impacts your product's direction, resource allocation, and ultimately, its success with users and for the business. My experience has taught me that AI metrics are fundamentally different from traditional software metrics. We're not just dealing with deterministic outcomes; AI introduces probabilistic predictions, data dependency and drift, and the crucial need to bridge 'offline' model performance with 'online' business and user experience. It's about ensuring your model doesn't just perform well on a technical benchmark, but genuinely solves a real user problem and moves key business indicators. To navigate this complexity, I rely on my AI Product Metric Framework. This means ensuring your chosen metrics directly align with clear business objectives, truly reflect genuine user value – measuring real problem-solving and satisfaction, not just surface-level interactions – and are always actionable, giving your team concrete steps to improve. You also need to consider robustness to gaming and bias, making sure your metrics don't inadvertently encourage undesirable behaviors. These insights are crucial for any AI Product Manager looking to make a real impact. For a deeper dive into my full AI Product Metric Framework, and how to apply it, head over to hinehal.com and check out the article.
As an AI Product Manager, one of the most pivotal decisions I face before any AI feature ships is defining its success metrics. It’s not merely a technical exercise; it’s a strategic imperative that directly impacts product direction, resource allocation, and ultimately, user adoption and business value. The right metrics ensure you’re not just shipping a model, but a valuable product experience that solves a real user problem and moves key business indicators. Getting this wrong can lead to misaligned development efforts, wasted resources, and features that fail to deliver their intended impact, even if the underlying model performs well on a technical benchmark.
My experience, spanning over 17 years in IT and a decade in product management across diverse domains like streaming, fintech, and healthcare, has taught me that the metrics conversation needs to happen early and often. It's about translating complex AI capabilities into tangible user benefits and measurable business outcomes. This guide will walk you through a structured approach to choosing robust evaluation metrics for your AI features, well before they ever see the light of day with your users.
Why Are AI Metrics Different from Traditional Product Metrics?
If you're coming from traditional software product management, you're used to metrics like page load time, uptime, conversion rates on static forms, or click-through rates on clearly defined buttons. These are often deterministic and directly attributable. AI, however, introduces a layer of probabilistic outcomes and dynamic behavior that fundamentally changes how we measure success.
- Probabilistic Nature: AI models provide predictions, classifications, or recommendations with a degree of uncertainty. This means a 'correct' answer isn't always binary. You're dealing with probabilities and confidence scores, which requires different evaluation methods.
- Data Dependency and Drift: AI performance is intrinsically linked to the data it's trained on. Data can change over time (data drift), leading to model degradation. Metrics must account for this dynamic environment and potential for performance decay post-deployment.
- Bias and Fairness: AI systems can inadvertently perpetuate or amplify biases present in their training data. Ethical considerations demand metrics that evaluate fairness across different user segments, beyond aggregate performance.
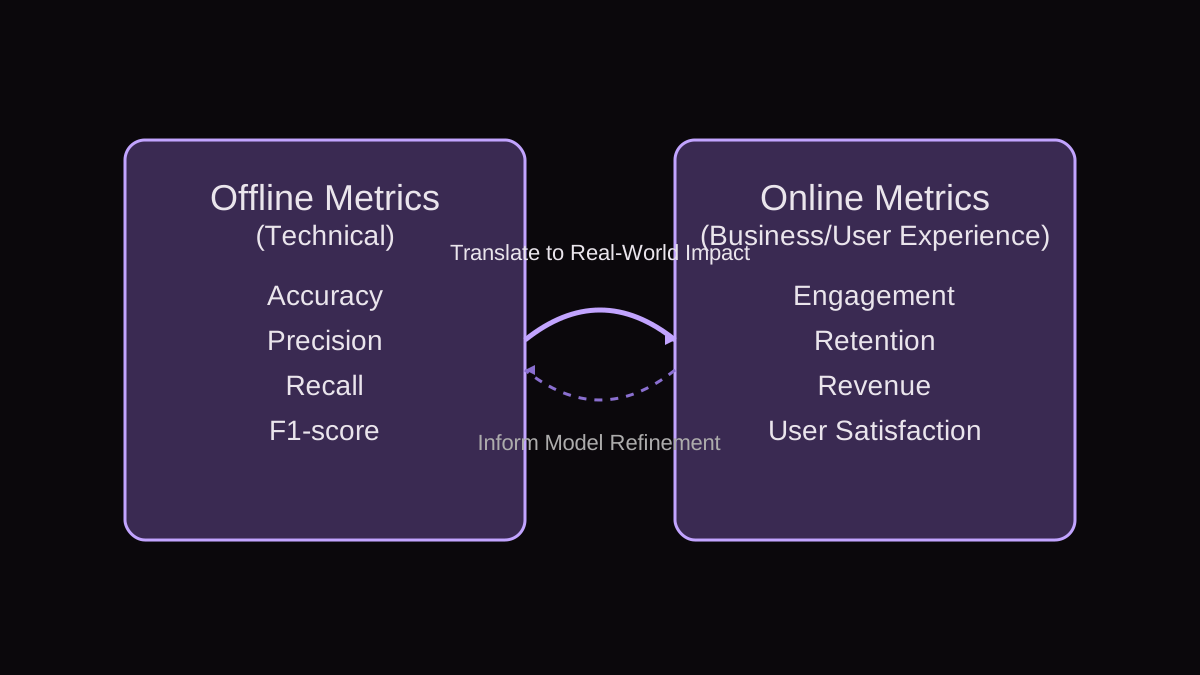
- Interplay of Offline and Online Metrics: AI features often have a set of 'offline' technical metrics (e.g., accuracy, precision, recall, F1-score) used during model development and training. These are crucial but insufficient. They must be explicitly linked to 'online' business and user experience metrics (e.g., engagement, revenue, churn) once the feature is live.
- Evolving User Behavior: Users interact with AI features differently than traditional software. Their trust, adaptation, and feedback loops are more complex. Metrics need to capture these nuances, such as user satisfaction with a recommendation, not just if they clicked it.
Understanding this distinction is the first step towards building a robust measurement strategy. You need metrics that can bridge the gap between model performance and real-world impact.
The AI Product Metric Framework (APMF): My Decision Rubric
To navigate the complexities of AI metric selection, I rely on a structured approach I call the AI Product Metric Framework (APMF). This rubric helps ensure that chosen metrics are comprehensive, actionable, and aligned with both technical excellence and business objectives. When evaluating any potential metric, I run it through these six criteria:
- 1. Alignment with Business Objective: Does this metric directly contribute to a clear business goal? Is it tied to revenue, cost savings, user acquisition, retention, or engagement? A metric that doesn't tie back to a strategic objective is a vanity metric. For example, if the business objective is to reduce customer support costs, a metric like 'reduction in support tickets related to X' is highly aligned. Conversely, if your AI model has 99% accuracy but doesn't impact any business goal, it's not a success.
- 2. User Value Proposition: Does this metric reflect genuine value for the end-user? Is it measuring whether the AI feature actually solves their problem or improves their experience? Metrics should capture user perception of quality, efficiency, or delight. For instance, if your AI personalizes recommendations, 'time saved finding content' or 'satisfaction score with recommendations' might be more valuable than just 'click-through rate' if the latter leads to users clicking but not engaging with the content.
- 3. Measurability and Attribution: Can we reliably collect data for this metric? Is it clear how to measure it? Crucially, can we confidently attribute changes in this metric to the AI feature, especially in a complex product environment? This often requires robust A/B testing infrastructure and clear event tracking. If you can't measure it accurately, or if multiple factors influence it making attribution impossible, it's a poor choice.
- 4. Actionability: Can the team (product, engineering, data science) take specific, concrete actions based on the insights from this metric to improve the product? A metric like 'overall system health' is too vague to be actionable. However, 'latency of AI inference for X feature above Y milliseconds' is highly actionable, pointing to specific optimization targets. Similarly, 'churn rate of users who frequently interact with feature Z' tells you where to focus retention efforts.
- 5. Robustness to Gaming and Bias: Is the metric susceptible to being 'gamed' by users or internal teams, or does it inadvertently encourage undesirable behaviors? Does it reveal or mask biases present in the AI system's output? For example, simply optimizing for 'clicks' can lead to clickbait rather than valuable engagement. Additionally, ensure the metric is evaluated across different demographic or user segments to detect unfair performance or bias. We need to ask: 'Does this metric truly reflect success, or just a superficial proxy?'
- 6. Cost of Measurement: Is it feasible and cost-effective to collect and analyze this data? Does it require significant engineering effort, new data pipelines, or specialized tools that outweigh the potential benefits of the insight? While some data collection is critical, sometimes a proxy metric that is easier to measure can be sufficient initially, especially for early-stage features.
By systematically applying the APMF, I ensure that every metric chosen serves a purpose, can be reliably tracked, and provides actionable insights for continuous improvement.
Worked Example: Personalized Content Recommendation Engine
Let's walk through a common AI feature: a personalized content recommendation engine for a streaming service. The goal is to suggest movies and TV shows that users are highly likely to watch and enjoy, leading to increased engagement.
- Scenario: A major streaming platform wants to launch an AI-powered 'Next Up' recommendation feature on its homepage. This feature will suggest specific content based on the user's viewing history, preferences, and similar user behavior. The business objective is to increase daily active user (DAU) watch time and reduce churn.
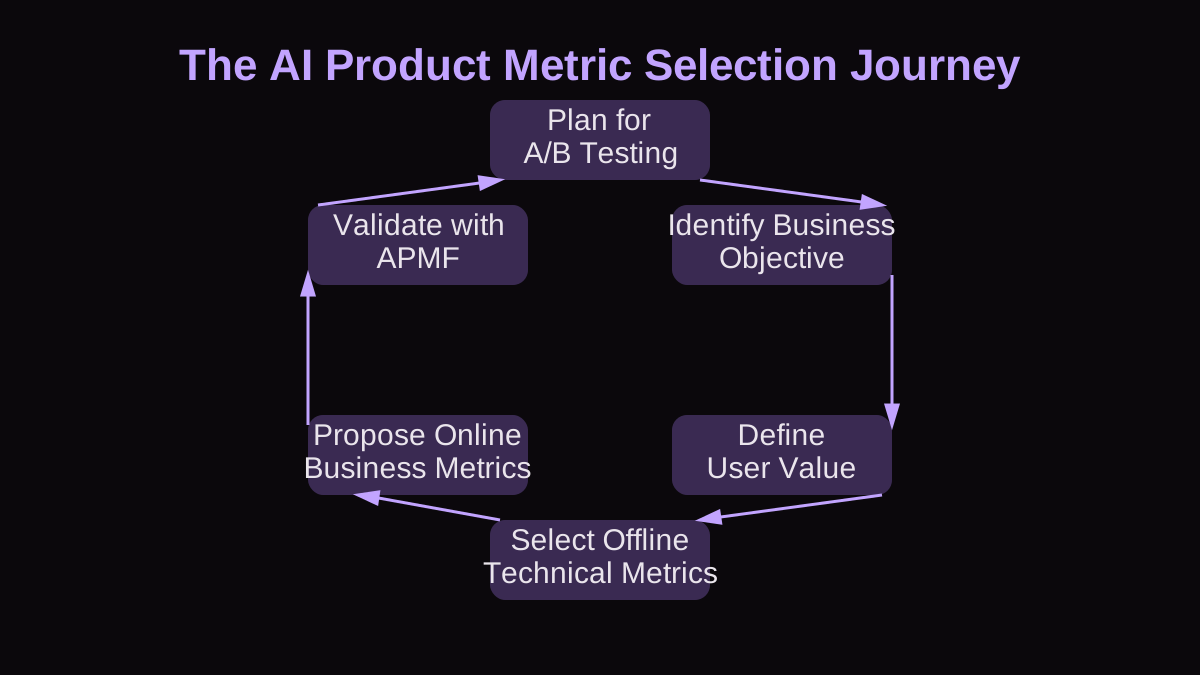
- Step 1: Identify Business Objective (APMF #1): The primary business objective is to increase overall user engagement, specifically measured by watch time per session, and to improve user retention by reducing churn.
- Step 2: Define User Value (APMF #2): The user value is to simplify content discovery, reduce decision fatigue, and help users find content they genuinely love, leading to a more satisfying viewing experience.
- Step 3: Propose Offline Technical Metrics: These are crucial for the data science team during development and initial model validation.
- * Precision@K: Out of the top K recommendations, how many were actually relevant/watched by the user? (e.g., if we recommend 5 titles, and the user watches 3 of them, Precision@5 = 0.6).
- * Recall@K: Out of all the content the user would have liked, how many did our top K recommendations capture? This helps ensure we're not missing good content.
- * F1-score: A harmonic mean of precision and recall, useful for a balanced view.
- * Mean Average Precision (MAP): A common metric for ranking tasks that considers the order of relevant items.
- Step 4: Propose Online Business & User Experience Metrics: These are the critical metrics once the feature is live and reflect real-world impact. These are often split into primary and secondary categories.
- * Primary Metrics (directly tied to feature success):
- * Click-Through Rate (CTR) on Recommended Items: Measures initial interest. (APMF #3: Measurable).
- * Watch Time from Recommended Items: The total duration users spend watching content initiated from the 'Next Up' section. This is a stronger signal of engagement than just clicks. (APMF #1: Business Alignment, APMF #2: User Value).
- * Completion Rate of Recommended Items: Percentage of recommended movies/shows that users watch to completion. This combats 'clickbait' recommendations and indicates true satisfaction. (APMF #2: User Value, APMF #5: Robustness against Gaming).
- * User Satisfaction Score (via surveys or in-app feedback): Direct qualitative feedback on recommendation quality. (APMF #2: User Value).
- * Secondary Metrics (broader impact, often lagging indicators):
- * Daily/Weekly Active Users (DAU/WAU): While influenced by many factors, a successful recommendation engine should contribute to overall platform stickiness. (APMF #1: Business Alignment).
- * Churn Rate Reduction for Users Interacting with Recommendations: If users find valuable content easily, they're less likely to churn. (APMF #1: Business Alignment).
- Step 5: Validate with APMF:
- * Are these measurable? Yes, through event tracking and A/B testing infrastructure.
- * Are they actionable? Yes, if Watch Time from Recommendations drops, the data science team can iterate on the model. If Completion Rate is low but CTR is high, it suggests the model is good at getting clicks but bad at providing truly engaging content.
- * Are they robust to gaming? Combining CTR with Watch Time and Completion Rate helps prevent optimizing for superficial clicks.
- * Cost of Measurement? Standard event tracking and analytics tools can capture this, making it feasible.
This structured approach ensures that both the technical performance of the AI model and its real-world impact on users and the business are thoroughly considered and measured.
Common Pitfalls in AI Metric Selection and How to Avoid Them
Even with a framework, it's easy to fall into common traps when defining AI metrics. I've seen these mistakes derail promising features, and knowing them helps in proactive avoidance.
- Mistake 1: Over-optimizing for Offline Metrics Only
- * Failure Mode: A model might achieve state-of-the-art accuracy, precision, or F1-score in a lab setting, but fail to deliver any meaningful value in the hands of users. This often happens when technical metrics are not carefully linked to user experience or business objectives.
- * How to Detect/Avoid: Always define clear online proxies for your offline metrics. Before shipping, ask: 'If our model hits X offline metric, what tangible user or business outcome do we expect to see?' Conduct A/B tests to validate these hypotheses. Supplement quantitative data with qualitative user feedback.
- Mistake 2: Choosing Only Lagging Indicators
- * Failure Mode: Focusing solely on long-term metrics like annual revenue or yearly churn reduction can make it impossible to iterate quickly. You won't know if your recent changes are working for months, leading to slow development cycles and wasted effort.
- * How to Detect/Avoid: Identify a mix of leading and lagging indicators. Leading indicators (e.g., initial engagement with a recommendation, feature adoption rate within a week) provide early signals of success or failure that allow for rapid iteration, even if they aren't the ultimate business goal. Ensure leading indicators have a strong, proven correlation with your lagging indicators.
- Mistake 3: Neglecting Edge Cases and Bias
- * Failure Mode: Your AI performs exceptionally well on aggregate but fails spectacularly or unfairly for specific user segments (e.g., minority groups, users with unique interaction patterns, or those with less data). This can lead to alienating users, brand damage, or even legal/ethical repercussions.
- * How to Detect/Avoid: Implement stratified evaluation. Always break down your metrics by relevant demographics, usage patterns, or data characteristics. Beyond aggregate accuracy, specifically monitor fairness metrics (e.g., equal opportunity, demographic parity) and analyze performance on identified edge cases. Build diverse test datasets and regularly audit model predictions for unintended bias.
- Mistake 4: Lack of Clear Hypotheses
- * Failure Mode: Launching an AI feature without clearly defined hypotheses for what success looks like. This results in data paralysis post-launch, where you have a wealth of data but no clear way to interpret whether the feature is working as intended or how to improve it.
- * How to Detect/Avoid: Before launching, for each chosen metric, formulate a clear, testable hypothesis. For example: 'If we introduce personalized recommendations, we hypothesize that Watch Time from Recommended Items will increase by X% for users in the treatment group compared to the control group.' This provides a benchmark for evaluating results.
- Mistake 5: Measuring Too Many Things
- * Failure Mode: When every potential metric is deemed critical, teams become overwhelmed, focus is diluted, and it becomes difficult to discern true signal from noise. Analysis paralysis sets in, and decision-making slows down.
- * How to Detect/Avoid: Prioritize ruthlessly. Identify 1-3 'North Star' metrics that represent the core success of your AI feature and the overall product. Supplement these with a few 'guardrail' metrics to ensure you're not negatively impacting other critical areas (e.g., if you optimize for engagement, ensure you don't inadvertently tank user privacy or introduce bias). Focus on what truly drives impact, not just what's easy to measure.
Iteration and Adaptability: Metrics Are Not Static
It’s crucial to remember that selecting metrics is not a one-time event. AI systems operate in dynamic environments. User behavior evolves, external factors change, and the underlying data can drift. What was a perfect metric at launch might become less relevant over time.
I always advocate for a continuous cycle of monitoring, evaluation, and adaptation. Regularly review your chosen metrics against current business objectives and user needs. Are they still providing the most accurate and actionable insights? Are new risks or opportunities emerging that require new metrics? Leverage A/B testing not just for initial validation but for ongoing optimization and experimentation. The ability to quickly adapt your measurement strategy is a hallmark of effective AI product management.
Key Takeaways
- AI metrics differ from traditional product metrics due to the probabilistic nature of AI, data dependency, and the critical need for fairness and ethical considerations.
- Start with business objectives and user value, then translate these into measurable offline (technical) and online (business/user experience) metrics.
- Utilize a structured framework like the AI Product Metric Framework (APMF) to ensure your metrics are aligned, measurable, actionable, robust, and cost-effective.
- Combine multiple metrics (e.g., CTR with completion rate) to get a holistic view and prevent optimizing for superficial engagement.
- Actively avoid common pitfalls such as over-optimizing for offline metrics, relying solely on lagging indicators, neglecting edge cases, lacking clear hypotheses, or measuring too many things.
- Metrics are not static; regularly review and adapt your measurement strategy as your product, users, and business goals evolve.
- Robust A/B testing infrastructure is non-negotiable for validating hypotheses and attributing impact to your AI features.